Live Data Insights
At Your Fingertips
Interactive dashboards that stream real-time data — so you always know exactly what's happening in your business.
Real-Time Analytical Dashboard Development
Overview
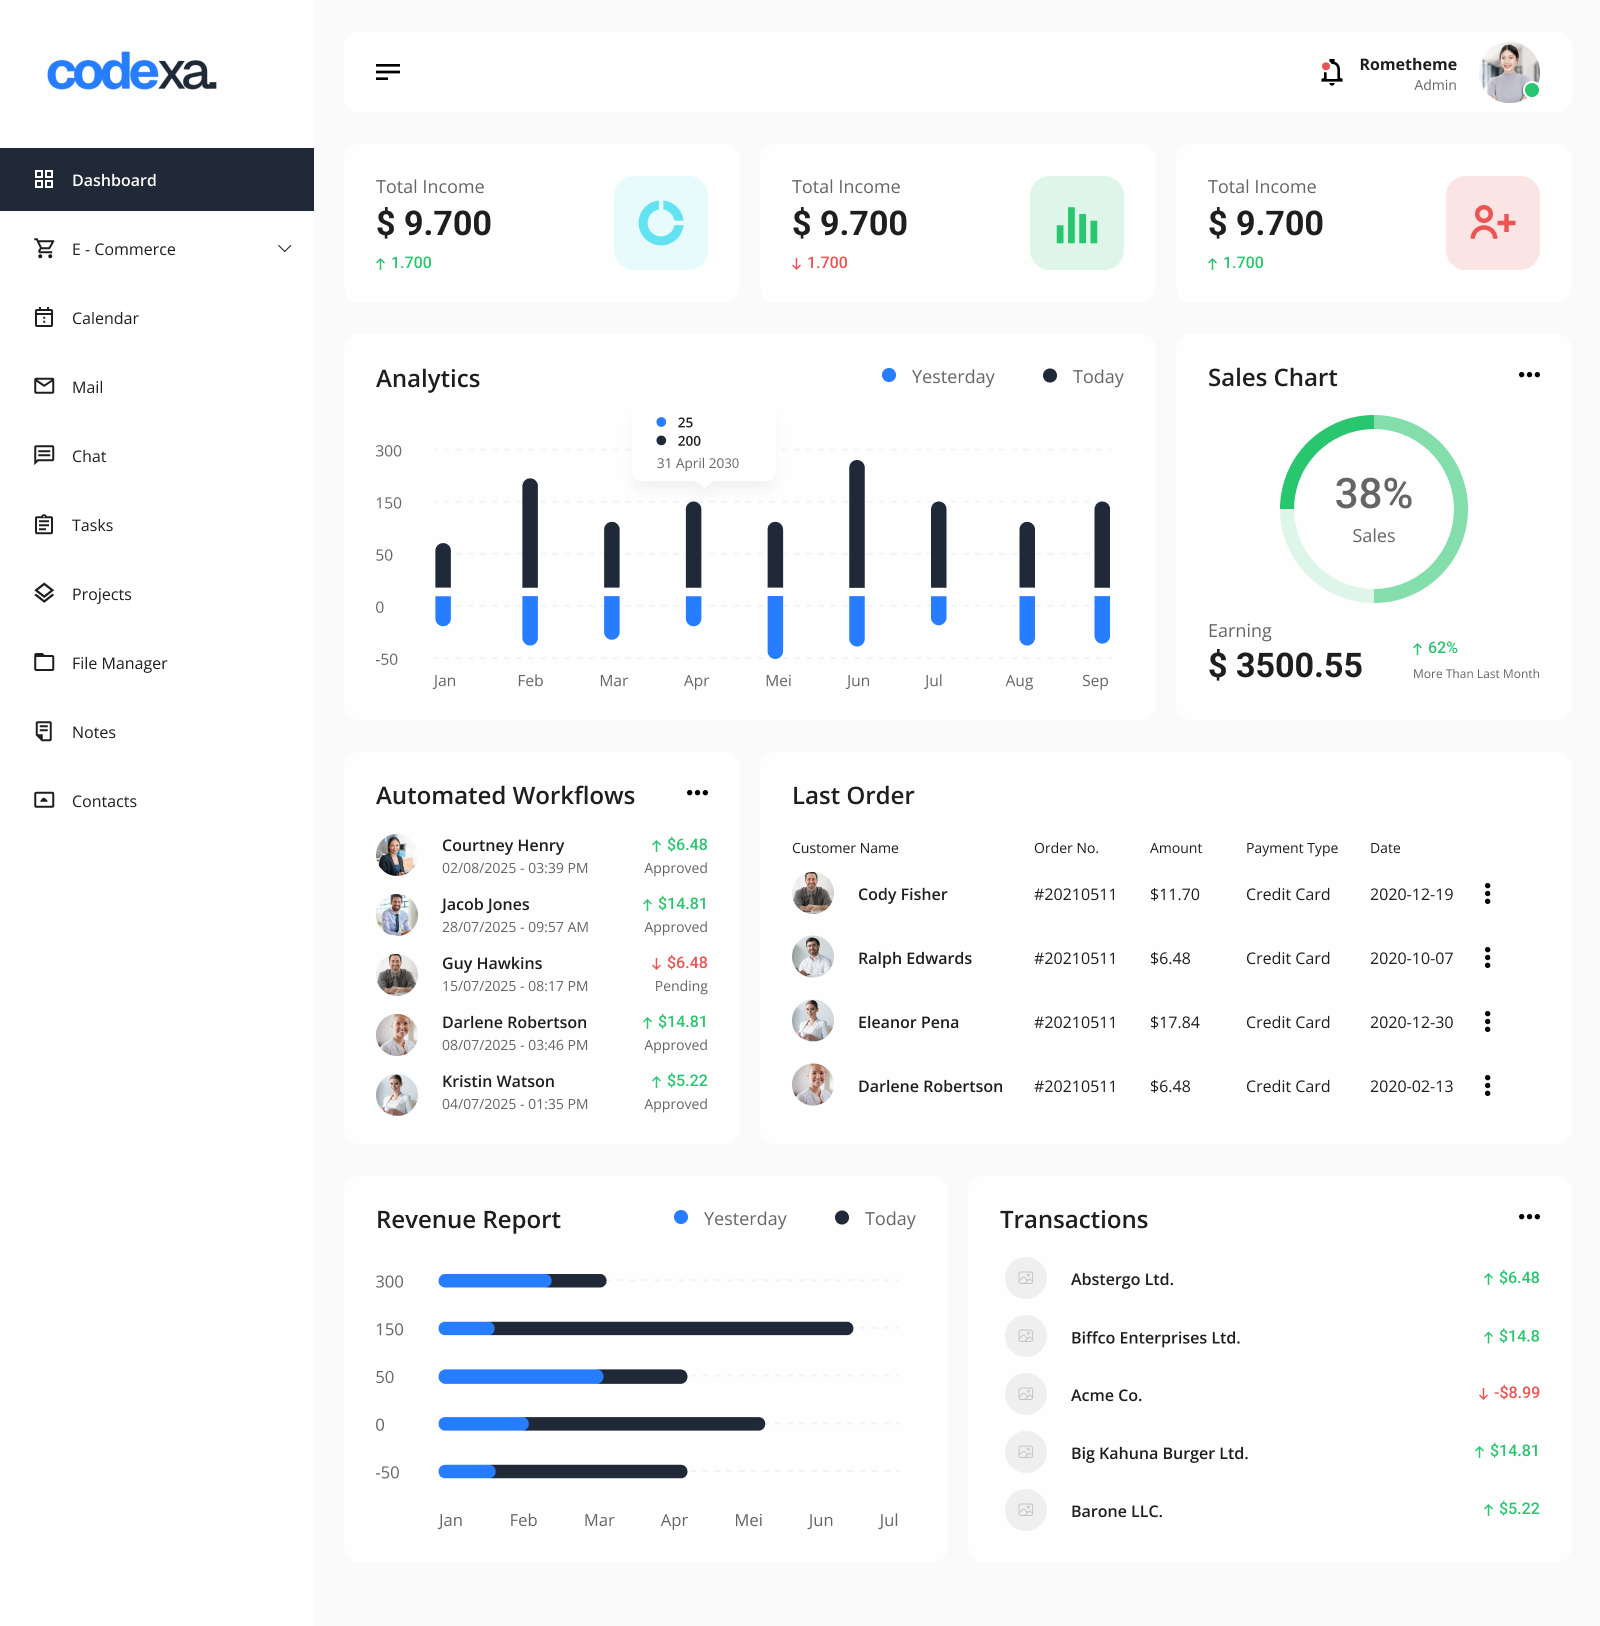
Data is only valuable when it's visible and actionable. We build custom analytical dashboards that pull from your live data sources and present them in clear, interactive visualizations — giving your leadership, operations, and sales teams instant access to the numbers that matter most.
From simple KPI displays to complex multi-source BI platforms, we design and engineer dashboards that update in real time, support role-based access, and are accessible from any device. No more waiting for end-of-day reports — your data is live, visual, and always current.

What You Get:
Dashboards designed around your exact metrics — revenue, conversions, support tickets, delivery times, or whatever your business tracks.
WebSocket and event-driven architecture that pushes data updates live without page refreshes — your numbers update as they happen.
Connect to databases (MySQL, PostgreSQL, MongoDB), APIs, spreadsheets, cloud services, and BI tools into a single unified view.
Bar charts, line graphs, heat maps, funnels, gauges, and custom visualizations built with D3.js, Chart.js, or Recharts.
Different teams see different data — executives see company-wide KPIs, sales managers see pipeline data, ops teams see logistics metrics.
Why It Matters:
Data you can't see in time is data you can't act on. Most businesses are making decisions based on yesterday's numbers — weekly reports, manual exports, and stale spreadsheets that show what happened rather than what's happening right now.
In fast-moving industries — e-commerce, logistics, finance, SaaS — a one-hour lag in data visibility can mean missed opportunities, undetected anomalies, and costly late reactions. The organizations winning today are the ones making decisions in real time.
Qyzen Tech builds dashboards that turn your raw operational data into a live, actionable command center — giving every stakeholder the right metrics, at the right time, without having to ask for a report.
Result:
A live operational intelligence platform that transforms your raw data into clear, actionable insights — accessible to every stakeholder in your organization, on any device, at any time.
Decision-makers stop waiting for reports and start reacting to live signals. Teams get the visibility they need to move faster, catch problems earlier, and seize opportunities the moment they appear. Your data becomes your competitive advantage.
Tech Stack We Use:
Our Delivery Process:
Data Source Audit
We map all your data sources — databases, APIs, spreadsheets, third-party tools — and assess quality and connectivity.
KPI Definition Workshop
Together we define exactly what metrics matter most and how they should be visualized for each role in your organization.
Data Pipeline Architecture
We design real-time or near-real-time data pipelines with appropriate streaming, caching, and aggregation strategies.
Dashboard UI Design
Custom dashboard layouts with role-specific views, drill-downs, and responsive design for desktop and tablet.
Build & Data Connection
Frontend charts connected to live data feeds with WebSocket or polling-based updates depending on latency requirements.
Testing, Access Control & Deploy
Multi-role access testing, permission audits, and production deployment with monitoring and alerting.
Key Benefits:
Industries We Serve:
Your Questions,
Clearly Answered
Everything you need to know about our Real-Time Analytical Dashboard services.